
Measure What Matters
Ten Talent Metrics that Actually Matter


“When a measure becomes a target, it ceases to be a good measure.”
- Goodhart’s Law
I tell all my data scientists and analysts that they need to have this quote from famed British economist Charles Goodhart on a sticky note stuck to their monitor, in their notebook, anywhere they need it to be to remind them that metrics and measures are things that support decisions about goals, not goals themselves. And the minute you focus on the metric and not achieving the goal it was set as an indicator for, you’ve lost the big picture.
My friend Steve Leonard wrote an excellent piece on this a few years back, detailing how the military’s obsession with metrics, and not their context or the goals they were supposed to support, was creating a data-rich but information-poor environment for decision makers. I’m pretty sure that anyone in corporate America reading his article will also be nodding in agreement and sympathy. Because the problem is everywhere.
It is especially prevalent in the era of dashboards.
The damn things are everywhere. Every chief of staff, every CHRO, every Army senior leader seems to have a growing collection of charts and graphs. Turnover numbers. Talent acquisition funnels. Mobility percentages. Time-to-hire. Headcounts and accountability.
And yet, for all the data that crops up on these glorious dashboards, we remain data rich but information poor. Your organization is probably drowning in metrics, but still starving for insights.
Why?
Let’s decode it. 🚀
Data, Decisions, and Dashboards, Oh My!
Keeping everything linked for effective data-driven decision making.

I wrote a whole book on data-driven talent management, and you know what? After working in this space, I really don’t care for the phrase “data-driven.” It puts the emphasis on the data and not the part that really matters—the talent management.
For your talent management strategy to be effective, the data has to flow in an information pipeline that supports your decisions and informs critical actions for your organization.
It’s actually not all that different than other critical information architectures you set up throughout your organization (I recently wrote an article on AI-ready systems and internal comms architectures for Reworked that addresses this in detail).
Which means you need more than just dashboards.
We built dashboards to prove we were “data-driven,” but in practice, they often create noise, not clarity. People often forget the context that we need to make sense of data, and instead of focusing on collecting the information needed to inform decisions, our dashboard builders focus on collecting data that’s easy and visible. They do just what Steve addressed in his article—focus on measuring what is measurable, not what actually matters to a decision maker.
If data do not connect directly to decisions, they don’t change behavior. Which means you just spent a whole lot of money on a bunch of pretty digital colors.
Let’s think about what we measure in the talent management sphere, and how that can help or hinder what we’re trying to do.
Time-to-hire (short is better)
Helps: improve employee experience and keeps talented employees in the funnel.
Hinders: recruiters rush to hire faster rather than better.
Turnover (bracketed target)
Helps: ensure retention works for talented employees, but keeps a healthy refresh rate - not every hire will be successful and not everyone needs to be permanent.
Hinders: managers pressure people to stay or offer bonuses or short-term fixes rather than improving working conditions.
Performance ratings (higher is better)
Helps: ensure we can identify talented contributing employees for growth opportunities and retention incentives.
Hinders: supervisors inflate scores instead of giving real feedback.
If we just focus on the numbers, they do exactly what Goodhart’s law indicates—they focus on the numbers as targets rather than indicators, and then it becomes gamified. The supported goal gets ignored and new problems get created as people make it a contest to get the “right” metrics rather than using metrics to inform decisions.
Okay, that’s probably enough bashing metrics. Let’s look instead at what we actually should be measuring in talent management and how these metrics inform decisions.
1. Role criticality.
No, not Critical Role, my Dungeons&Dragons fans, although I won’t lie—a huge amount of the initiatives I’ve introduced into Army talent management have been shaped by the 20-sided dice. And role criticality could fit into any party composition.
The basic idea here is that while most organizations treat headcount as interchangeable, it isn’t. Some roles are keystone roles—if you lose them, the entire system suffers. Others are supportive, operational, or optional.
Being able to understand and measure role criticality tells you:
Where to invest your retention efforts
Where vacancies do the most damage
Which roles require stronger pipelines
Which teams can absorb risk.
Role criticality clarifies where you may have the hardest time attracting talent and where you might be overspending time, attention, or urgency.
2. Skill inventory and depth.
What capabilities do we actually have?
Forget jobs and job descriptions. If you plan your workforce only using what you think you have with job descriptions, you shove your employees into a box that discounts a lot of what they might bring to the table.
Organizations assume they know what skills exist in their workforce, but most have never mapped them systematically. Skills inventories—whether self-reported, credential-verified, or assessed (and they should be a combination)—tell you:
What you can leverage internally for emerging requirements
Where you have gaps
Where your workforce is over- or underskilled
What training is actually needed and useful
This is the foundation for internal mobility, reskilling, workforce agility, and what I like to call adaptive talent, talent that you know down to the raw ingredients and can repurpose as your organization adapts for the current pace of change.
3. Internal mobility velocity.
Having adaptive talent doesn’t mean you can hire people quickly, but that you can flex your internal workforce quickly. Internal mobility velocity measures just how fluidly you can realign skills to new problems.
High mobility organizations can shift capacity quickly. Low mobility organizations have to rely on sometimes dry talent pools and long time-to-hire to fill emerging requirements.
The future of work belongs to organizations who can realign talent and don’t have to wait to replace it.]
4. Quality of match.
You hired people who fit the roles—but are they in the right roles?
Quality of match can be measured through:
First-year performance
Hiring manager satisfaction
Skill-role alignment
Early turnover
Promotion or development trajectory
This metric cuts through vanity numbers like “offer acceptance rates” and instead measures the actual impact of hiring decisions.
5. Managerial effectiveness.
If you track only one thing to support employee experience, make it this one. You know the saying that people are more likely to quit bosses than quit jobs? It’s real. Go follow Corporate Sween for some doozy stories.
Manager quality predicts:
Retention
Teamwork
Performance
Psychological safety
Burnout
Creativity and innovation
This metric is also highly tied to things like:
Team-level turnover
Internal mobility
Engagement markers
Peer feedback
We learned this in the Army, and that’s one of the reasons we’ve been after ways to reform how we do promotion and leader selection. Your talent strategy is useless if you don’t have good leaders where the rubber meets the road. And I’m sorry, my senior folks, while you might be guiding your company, your managers are guiding, developing (or not), and impacting your workforce.
6. Time-in-role distribution.
Are your people stuck?
Organizations often reward long tenure in a job as loyalty and continuity, but too much time in place is stagnation. Sure, you don’t want everyone transitioning at the same time, but you still need them to grow and learn.
Time-in-role distribution reveals:
Where career advancement is blocked
Where emerging leaders might be trapped and leave
Where burnout is brewing
Where skills need refreshing
This is one of the most powerful early-warning indicators of future turnover for your talented up-and-comers.
And it’s also something you need to investigate if you’re trying to implement organizational change. In some cases, I’ve found sages in our organization who have been working for a long time to improve programs that they’re passionate about. In others, I’ve found roadblocks who are determined to protect their own complacency.
7. Development yield.
Is your learning program producing capability?
Most organizations measure training by attendance or completion. That tells you nothing.
I’d love to give a survey after all our mandatory sexual harassment training and equal opportunity training and see what people’s actual attitudes are, and if those have been impacted, because right now mandatory attendance is not yielding any kind of significant change in behavior.
So let’s talk about collecting data on what people actually learn. Development yield means we measure:
Skill gain
Behavior change
Application to the mission
Impact on performance
This is the metric that distinguishes training as just a perk to development as a real force shaping strategy.
8. Flight risk indicators.
Who is likely to leave, and why?
My amazing friend Cathy at Enolytics has done some terrific work on this for the Army with the Georgia Tech Research Institute—would you believe that the same markers that show someone is about to leave a wine club also show us if a family is likely to start pressuring a service member to leave?
It’s all about patterns of disengagement, and you can capture these, too:
Decreased internal applications
Declining engagement score
Increased absenteeism
Stalled progression
Managerial conflict
Skill underutilization
This allows targeted, human-driven interventions, which work a lot better than blanket retention bonuses or generic morale campaigns (anyone else getting shades of Office Space “and tomorrow is Hawaiian shirt day” whenever someone brings up a new morale campaign?).
9. Workforce agility ratio.
How well can you and your workforce respond to change? This is an emerging metric, but an essential one.
The agility ratio reflects the percentage of your workforce that can be:
Reassigned
Reskilled
Redeployed
Upskilled
Cross-functional within 60-90 days
The organizations that survive disruption and transformation are the ones with the most adaptable talent, and the workforce agility ratio is the key to seeing just how adaptable your talent is.
10. Execution throughput.
Can your workforce actually deliver?
Execution throughput sits at the intersection of talent and operations. It measures the speed and quality of work through the system, revealing:
Where talent is misaligned to strategy
Where bottlenecks are human capital problems
Where process or workforce design is broken
This is the closest thing we have to a talent performance indicator.
How do we present these (don’t say dashboards)?
Dashboards have a fatal flaw in that they present metrics…without context. It’s just a number. A trend. A chart. A thing.
I used to teach collegiate-level stochastic modeling, and part of that was a probability refresher course (my department wanted to punish me). When I taught various lessons, I introduced a level of argument that I think made my department worry that they’d accidentally hired an English major, but the point was to introduce the concept of context.
When I taught confusion matrices, it wasn’t enough that we just calculated Type 1 and Type 2 error (a hint for those who don’t remember, Type 1 is false positive, Type 2 is false negative). I made my students discuss whether or not the result was “good.” Okay, you had Type 1 as 6%. Was that good? What was good.
I introduced a zombie apocalypse scenario where the result we were testing was the probability of a test that indicated if someone had contracted the zombie virus. My students argued whether or not the test was accurate, and then I threw in an added wrinkle—what happens if you have to shoot a person who tested positive? Was 6% still good enough?
Context.
Metrics only matter if they:
Influence how you prioritize resources
Change a process
Shift a priority
Inform a talent move
Highlight risk
Reveal opportunity
If you just create a dashboard without considering the context, or how the data you present will turn into information that influences one of the decisions above, you’ve kind of just created a screensaver.
Start with the decision.
Backtrack to the information needed to make that decision.
Look at the pipeline you need to get the best information possible.
Identify where the data used to derive that information live.
Create your products accordingly. Even if that product might be a (sigh) dashboard.
Talent metrics are about action.
What gets measured gets attention. We need to make sure what gets attention actually properly informs decisions.
The ten metrics I’ve listed don’t provide a total talent story or context, but they’re a pretty good foundation for a data-driven talent ecosystem.
They help you shift from:
Counting people → understanding capabilities
Filling jobs → aligning talent
Reviewing dashboards → making decisions
Reporting numbers → focusing on outcomes
This is the work of modern talent leadership, and it’s at the heart of what Data-Driven Talent Management was always about—not more data, but better decisions.
And speaking of my little book baby…
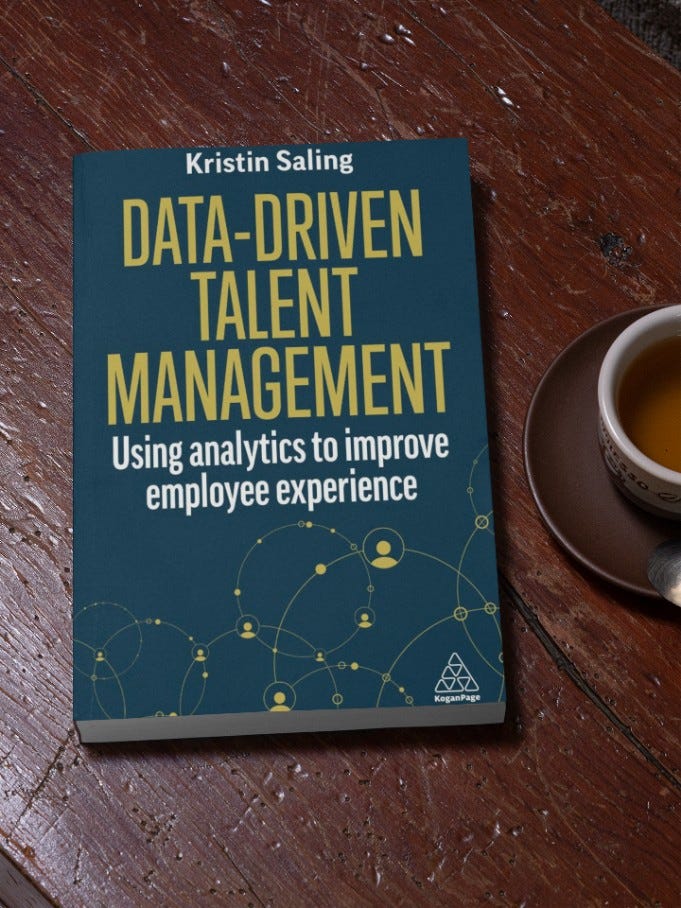
If Data-Driven Talent Management helped you, please take 2 minutes to leave a review for me over on Amazon—it makes a big impact.
Also, my awesome publishers at Kogan Page are still having their 40% off sale on all books through 1 December (today!!)! Go and get your favorites using the code SALE40!
Measure what you Treasure.